Afte Looking into trading my MPF savings with AIA i came to the conclusion that the AIA website is terrible.
The only historic information about the funds is a table. Maybe they post a printed report every year but I tend to bin or lose that before I’ve had a chance to read it.
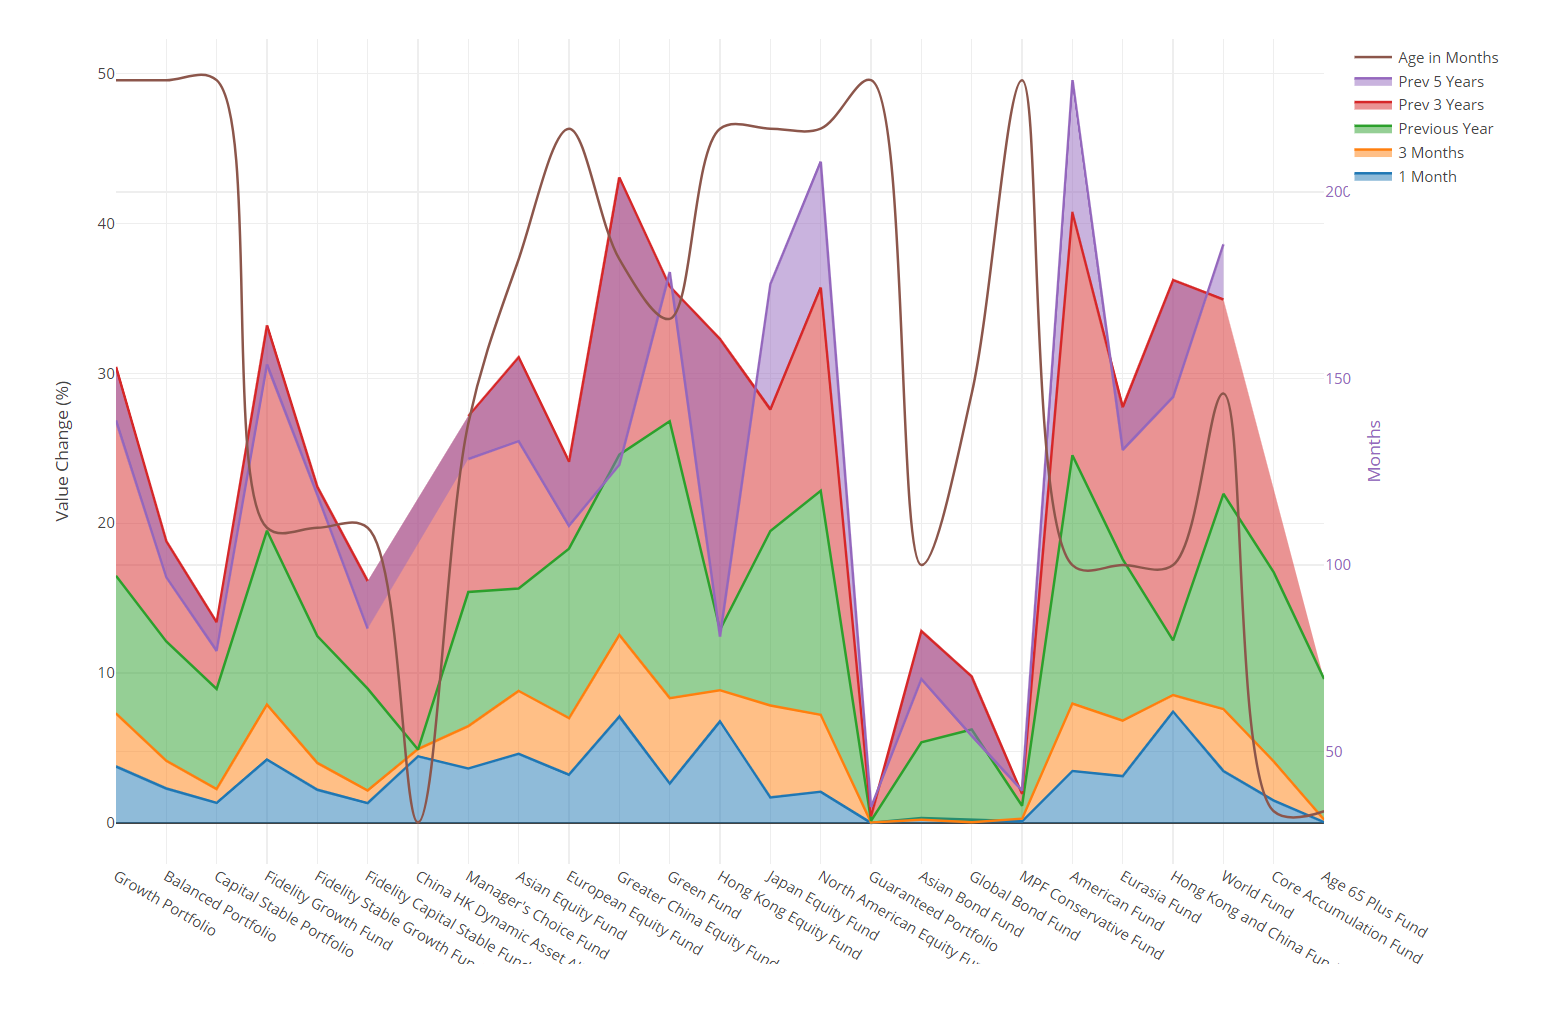
I found this public site with an IFrame embededding a page with the latest performance table and less HTML cruft, and put the data into Plotly for the graphs (https://plot.ly), dates in JS seemed a lot harder to parse from a string than they should, so I used Moment.js (https://momentjs.com/).
Providing a dateformat param returns a valid date when looking at strings that have an ambiguous structure like DD-MM-YYYY or MM-DD-YYYY which would otherwise cause an Invalid Dateformat JS error.
Calculate difference between two dates in months using javascript
var now = moment(new Date()); //todays date
var end = moment("12-12-2001", "DD-MM-YYYY"); // another date
var duration = moment.duration(now.diff(end));
var result = Math.ceil(duration.asMonths());
Some of the sanitisation is done server side with PHP with str_replace and explode, nothing special. The rest is JS.
Table CSS was taken from here, probably